A Gantt chart template is pre-made model of a bar chart. It allows its users to draft a customized graphics by inserting their specific data to the predefined frame. In many ways, this document can be useful. For example, with the help of template, you can make customized Gantt chart to deal with your strategic planning process, research project, etc.
Table of Contents
- 1 What is a Gantt chart?
- 2 Where Gantt should be used?
- 3 Who can use a Gantt chart Excel template?
- 4 Basic parts of a Gantt chart:
- 5 Things you should consider when making Gantt charts:
- 6 What are the key benefits of Gantt chart template?
- 7 The advantages of an Excel Gantt chart template:
- 8 The disadvantages of an Excel Gantt chart template:
- 9 Conclusion:
- 10 Faqs (Frequently Asked Questions)
What is a Gantt chart?
The Gantt chart is the most reliable tool when it comes to project management. It is generally used for organizing and scheduling projects. It simply informs you about the overlap of processes. It enables the project managers to quickly see the status of any project and gives estimate about how long the project will take to complete. Furthermore, it clarifies the projections by presenting a lot of information in a single look.
Where Gantt should be used?
You should use Gant chart when you are planning any project and you need time estimations. The main component of this chart is time estimation. This is because without exactly knowing how much time each process will take in the overall project, you can’t create a true Gant chart. However, giving time estimation for small tasks is very easy. When you have all done with time estimation of all the projects, you just have to chart them according to their start and end dates and you will be done.
At the end of 16th century, Gantt charts were first created. They were popularized during World War 1. These charts were widely used by the military forces of USA during World War 1. It would be considered an extremely useful tool for military operations because they include many processes and all are dependent on each other one way or the other. Additionally, they are extremely helpful and adapt by managers in many different industries.
Who can use a Gantt chart Excel template?
This visual tool is used by project managers to organize tasks and make a project schedule. The project managers ask their team members to ensure that they are prioritizing the right tasks and identifying task dependencies correctly. Furthermore, your best resource is your team that assist you in understanding how each task interacts with the next.
The Gantt chart template can see by the stakeholders to know about the progress of the project as they have invested in the successful outcome of the project. Any user can use the Excel Gantt chart because it serves as a point of comparison to your actual progress.
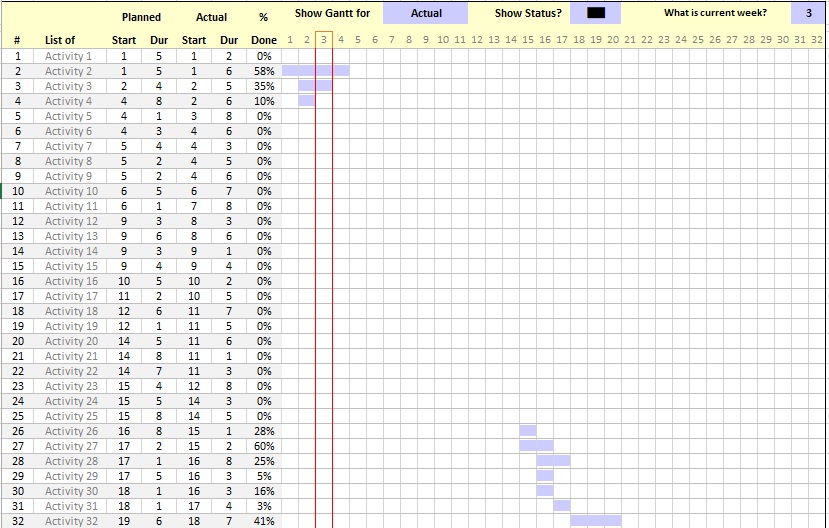
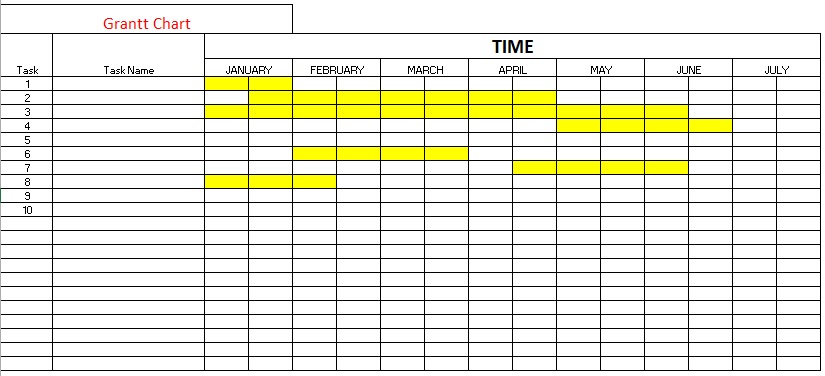
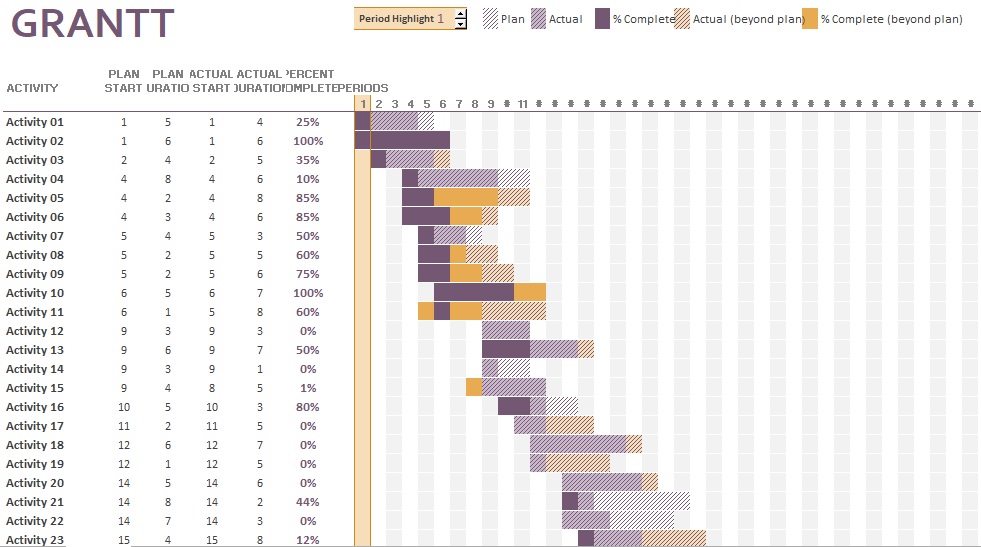
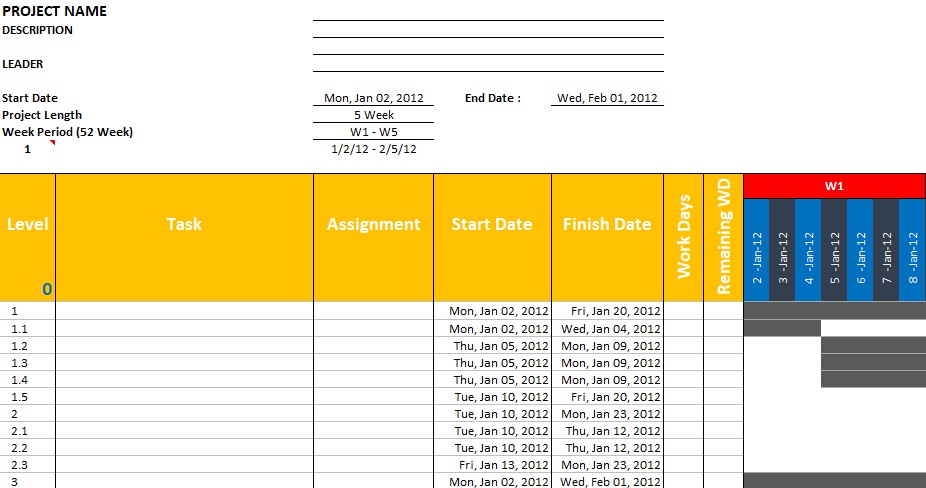
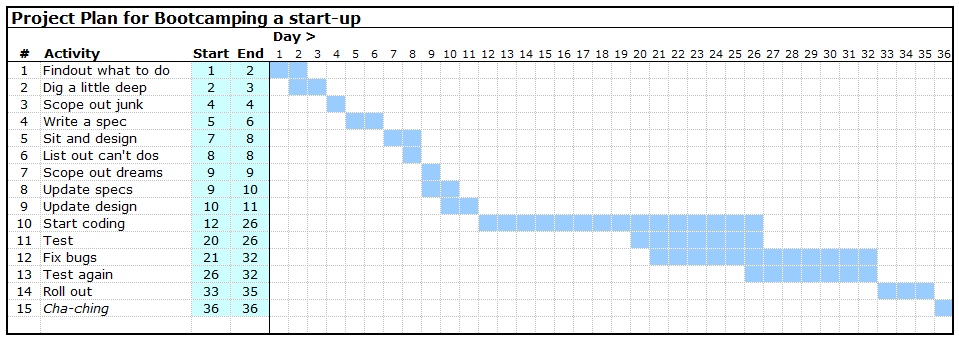
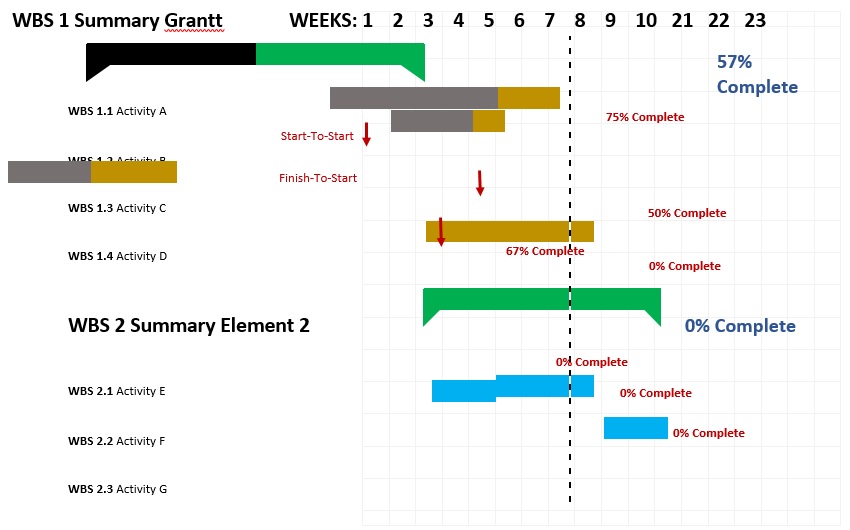
Basic parts of a Gantt chart:
For making a Gantt chart, you have the following information in it;
Activities:
You should show each and every activity of the project so it is the first thing you need to take care of. If any of the activity missed then the results can be catastrophic for project completion. Moreover, when you skipped an activity upon which other activities were dependent then you time estimation is completely unrealistic or that you cannot complete the project. You should make sure that you have listed all activities that will be involved.
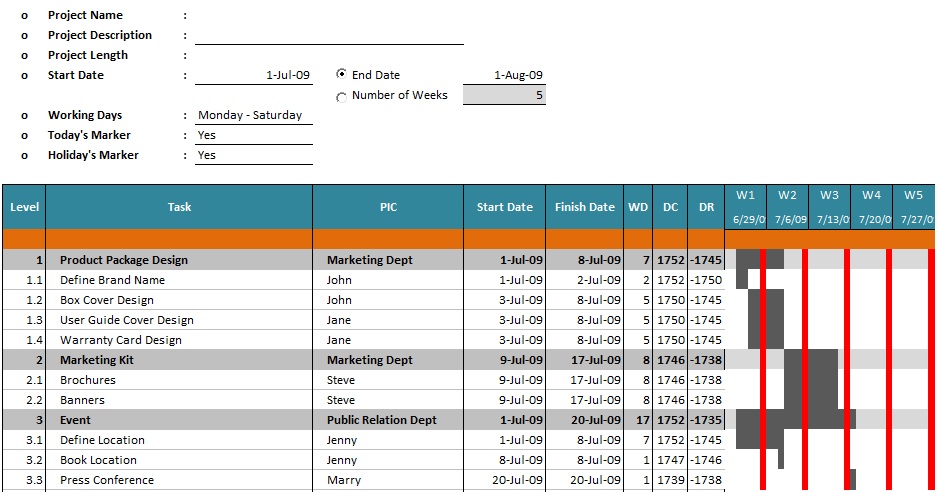
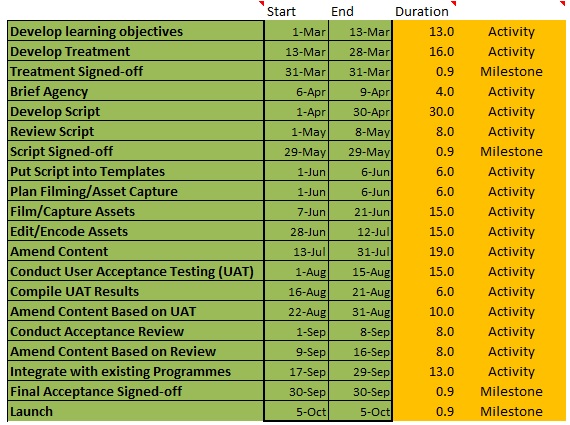
Time estimates:
Time estimation is another important component of Gantt chart. Without time estimation, you can’t indicate which activity overlap and when dependent activities will begin. For small projects, you can easily estimate how long each task will take but for bigger projects a more realistic approach is taken. In addition, there are three kinds of time estimates;
- Optimal time estimates,
- Normal time estimates,
- Pessimistic time estimates
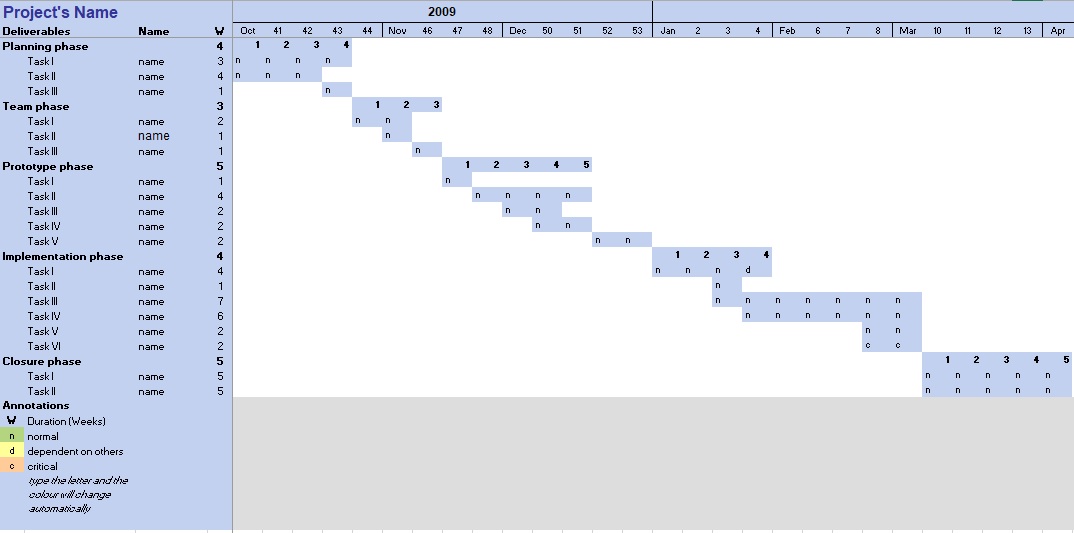
Predecessors:
A predecessor is an activity upon which another activity depends and it should be accurately studied. For instance, if you are building a house before paint you have to put up the walls. So, put up the walls are predecessor for the painting activity to begin. A well-designed Gantt chart will accurately define predecessors in the chart.

Things you should consider when making Gantt charts:
You should avoid the following common mistakes while making Gantt charts;
Being too hopeful with time estimates:
This is the most common mistake that most of the managers make. However, the experienced managers know that can be different from expectations. Big projects have multiple processes so you don’t have to assume that every process will go off without difficulty. Some managers enhance the time estimates so that their estimation will proof accurate. For example, if a process should be completed in two months they will give an estimation of three months. In this way, if something goes wrong it can be covered without making the project late.
Confusing the chart too much:
Don’t insert too much detail in the chart. Some people in order to cover up everything insert too many activities in the chart and then chart becomes incomprehensible. Don’t forget that the main purpose of this chart is to demonstrate how long processes will take, the relationships between processes, and time estimations. Hence, if you provide too much detail then your chart wouldn’t inform you anything about the project. You should create multiple charts instead of making a single chart too complex.
Managing the chart static:
You should create your Gantt chart in such a way that it provides the information about the progress of the project at a single look. If you want that your Gantt chart continues to be a useful tool for you then you should keep updating it with updates time estimates.
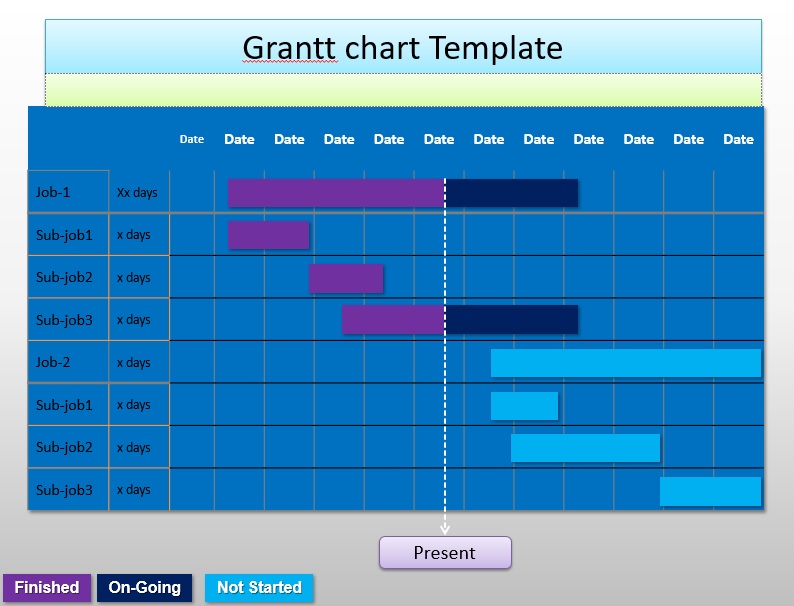
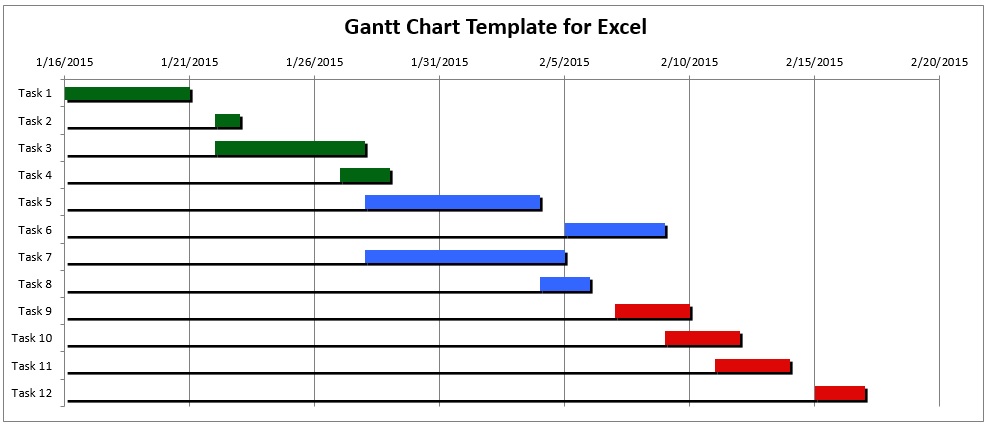
Absence of color coding:
You should start color coding activities if your chart is becoming too complex. You can do this by assigning color activities based on the teams that will be working on them. By giving each activity its own color, you will run out of colors. Instead of increasing the amount of information, you should color the graph based on who will be performing the activities. Thus, people can easily see who needs to complete their work to move the whole project quickly.
What are the key benefits of Gantt chart template?
Let us discuss below the key benefits of using a Gantt chart template;
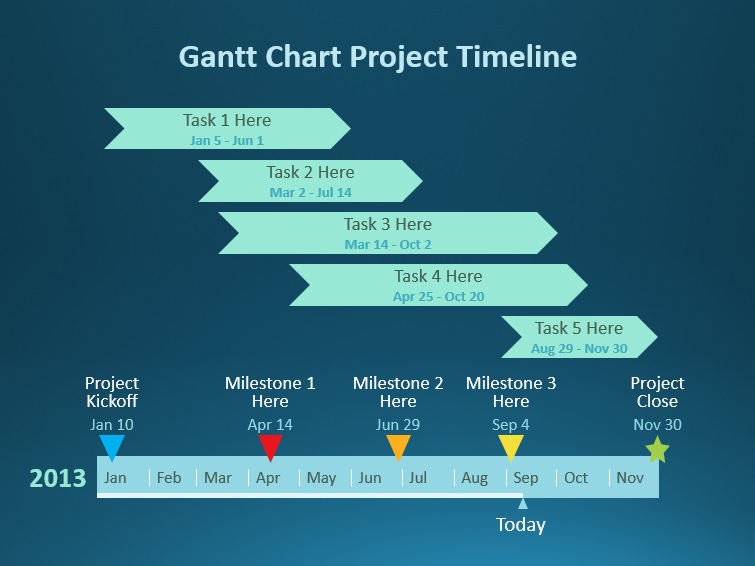
Provide a high-level glimpse of your whole project
The visual nature of the Gantt chart provides a high-level glimpse of your entire project. They are simple to understand and your project manager can know exactly what’s going on by looking at a Gantt chart. Also, the team members, stakeholders, and other department heads can see the key points easily.
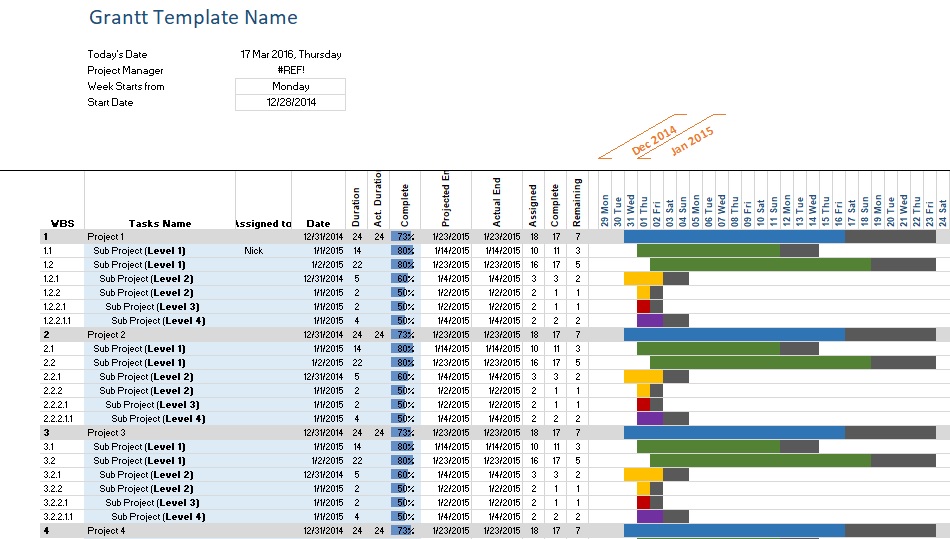
Track project progress in real-time
For your project, a Gantt chart acts as a geo-tracking device. It tells you the critical path for your project schedule. It is the minimum set of tasks that you have to complete to meet your project deadline.
Maintain project transparency
Gant chart is an important tool for all members of a project team. Project managers use it to make high-level decisions. It is the most reliable way to present the big picture to get everyone on board. It can promote open communication among team members, improve overall team performance, and encourage members to hold themselves liable.
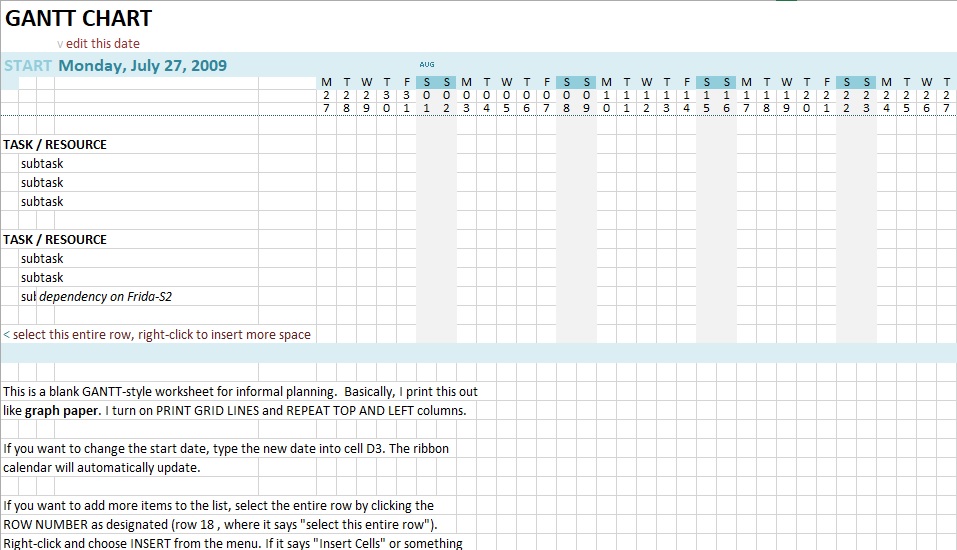
The advantages of an Excel Gantt chart template:
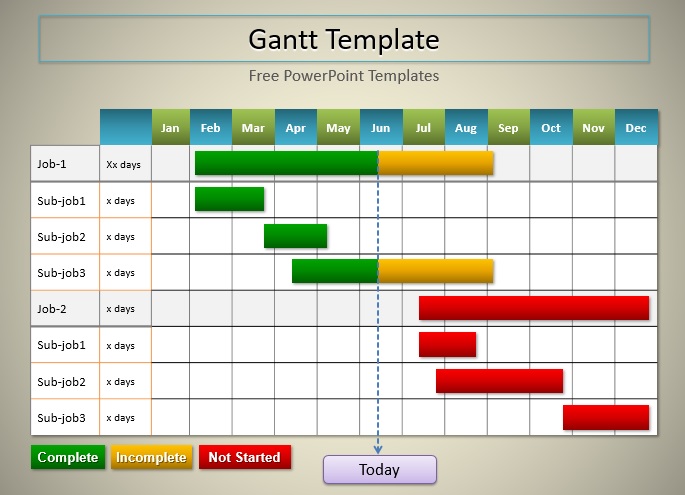
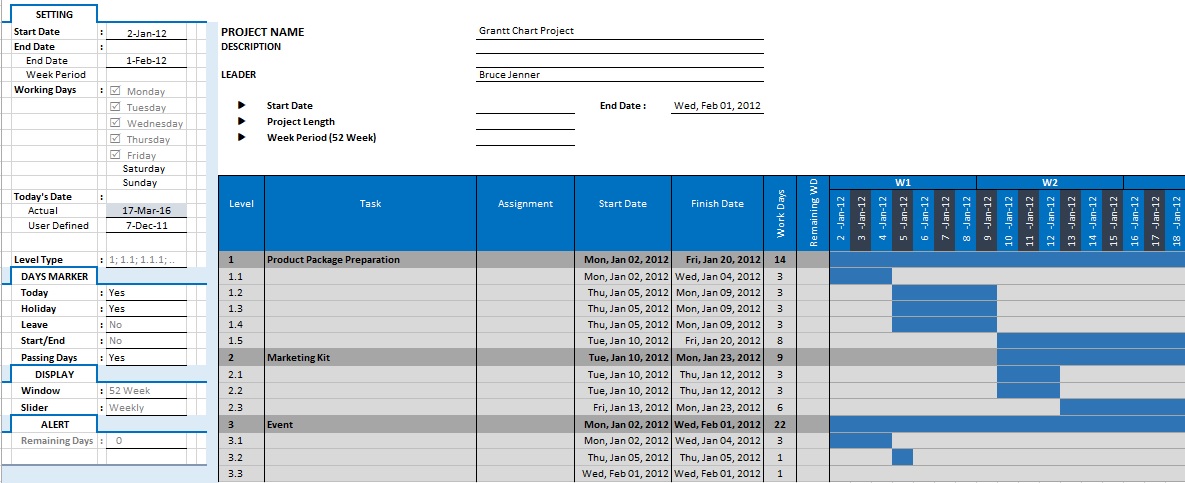
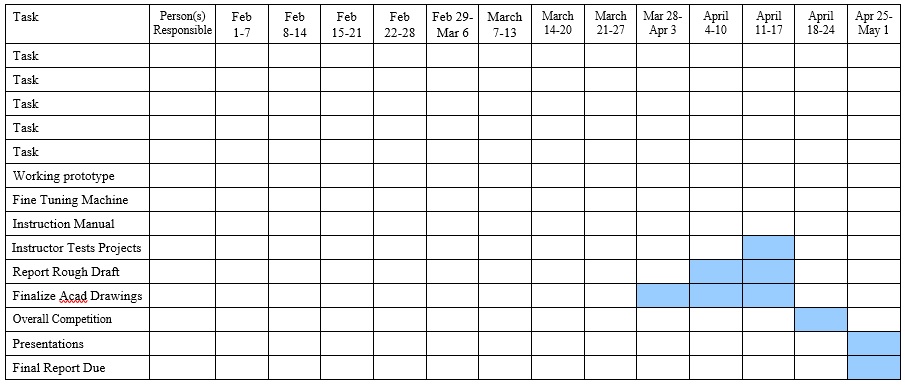
It doesn’t matter how many you have in your project plan, you can mention all your tasks on the Gantt chart. After that, you can set the start and finish dates. With a duration bar, this data puts the tasks on the timeline. You can color-code the tasks to show the project phases. This Excel Gantt chart makes you able to make a basic project schedule.
The disadvantages of an Excel Gantt chart template:
The Excel Gantt chart template can’t allow you to link dependent tasks. It means you can’t start or finish some tasks until another task has started or finished and it is referred as task dependency. By using this template, you can’t assign tasks to your team and they don’t know when to start working on the project. The template also won’t reflect their updates in real time and you have to enter the data manually.
Conclusion:
In conclusion, a Gantt chart template is a helpful tool that makes the project management easier by making things easier to understand. These charts will be very helpful if you use them in a right way. They are more vital tools for planning and scheduling projects. Moreover, in these pre-built models, you just have to put specific data to the pre-defined frame.
Faqs (Frequently Asked Questions)
No, Excel doesn’t have a Gantt chart template. So, you have to make it manually in Excel. After that, you can save it as a template for future use.
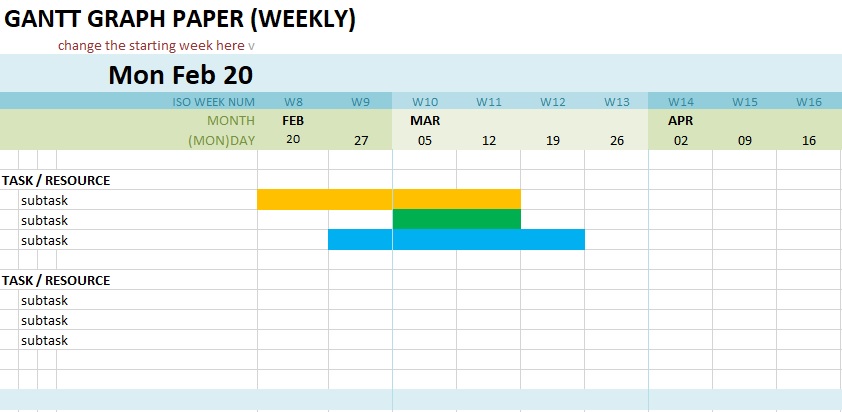
Consider the following steps to format a weekly Excel Gantt chart;
1- To select Format Axis, right-click on the date axis.
2- Enhance the Axis Option section.
3- Into the Major Field below Units, enter 7.0 for weekly intervals.
Here are the steps to format a monthly Excel Gantt chart;
1- To select Format Axis, right-click on the date axis.
2- Enhance the Axis Option section.
3- Into the Major Field below Units, enter 30.0 for monthly intervals.