You need a goal chart template for keeping track of your progress in achieving your desired goals. Every person has their own life goals. But, due to some reason, we tend to lose track of them over time. By having a goal chart, you can gain the capability to clarify the goals that you set for different purposes.
What is a goal chart and its purpose?
A goal chart is a tracking system used to record the progress towards a specific goal. This chart can split your big goal down into smaller. It makes you able to measure your progress towards your goal.
The main purpose of a goal chart is to reach both personal and professional objectives. They provide you a daily injection of encouragement that assists you in keep going when you feel like giving up. Bu having a goal chart, you can know how far you’ve come and how much you’ve achieved.

Types of goal charts:
You can create goal charts for the following different purposes;
Weight loss
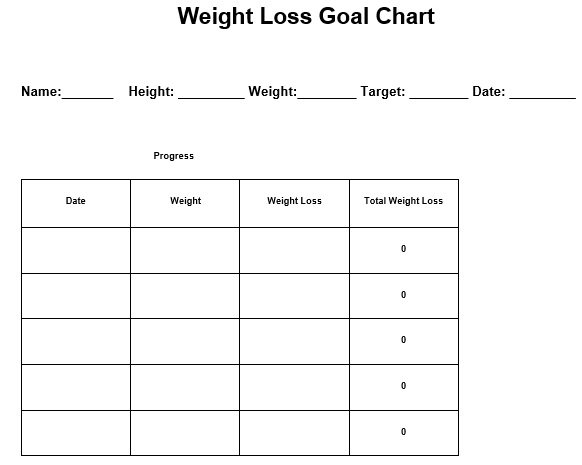
You should make a weight loss goal chart in order to shed those extra pounds and become healthier and feel more confident. You will create this chart with table columns that includes the;
- Dates
- Your current weight
- The weight you have lost between the current date and the last date you weighed yourself.
- The total weight loss
Sales
If you’re in the business of sales, use this chart to achieve different goals that your sales personnel have. You can also write down your employees’ status of achievement. This type of chart will assist you in keeping track of your employees’ progress.
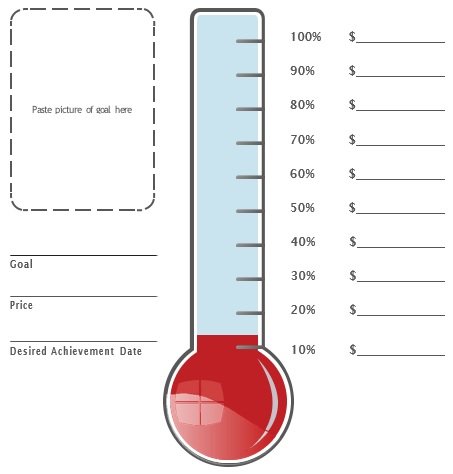
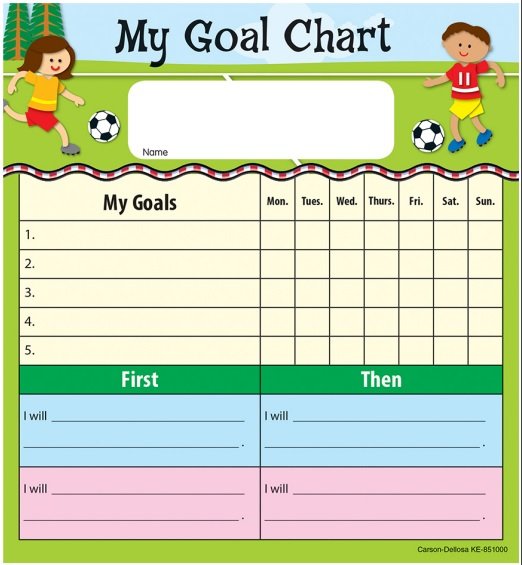
Personal Goals
You can use personal goal chart to keep track of your goals on a more personal level. For example, if you want to purchase something that you have longed for a while then paste a photo of that object for motivation. After that, note down a date when you want to purchase it. Then, start saving money for it.
Weekly Goal Tracker
This chart contains goals that you have to achieve every day for a whole week. Keeping yourself updated and aware is a great way for you to keep track of these goals and accomplish them.
Stages of life
In this type of goal chart, you have to note down the goals that you set for each stage of your life. These goals can be regarding finances, education, wellness, travel, family, and so on.
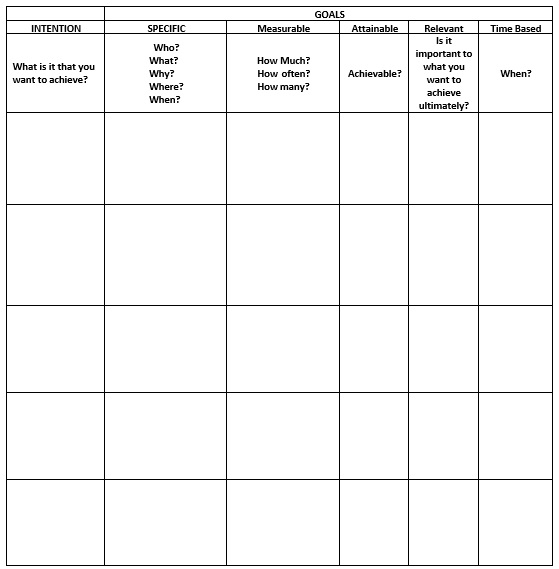
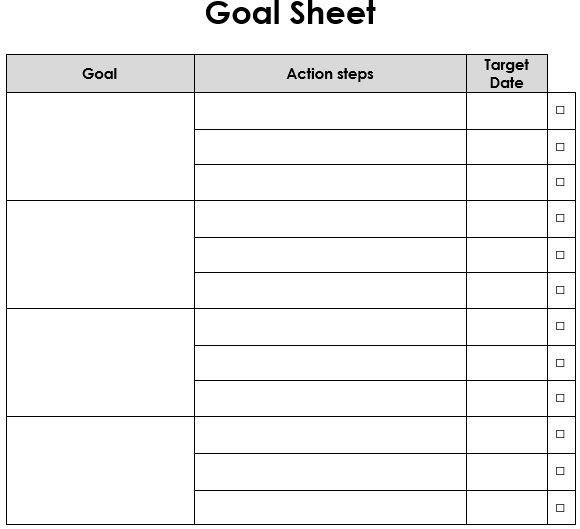
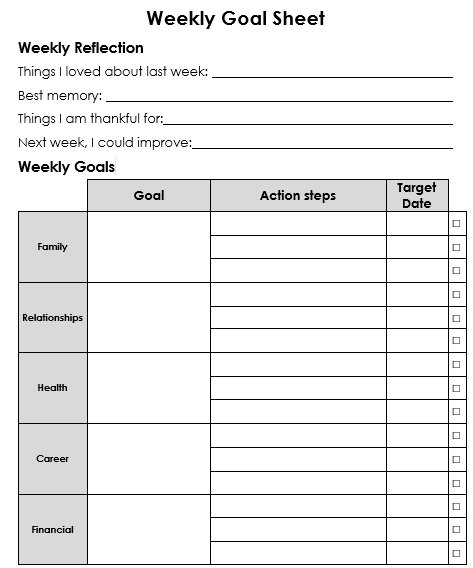
What to write in a goal sheet?
Before working on your goal chart, you have to make a goal list first. Firstly, identify your long-term goal and then make sub-goals that lead you towards your major goal. Measureable outcomes and deadlines must be included in sub-goals.
When you have done with writing down your sub-goals then define your objectives in the next part. Objectives are the essential things that you have to achieve to reach each of your sub-goals.
How to create a goal chart?
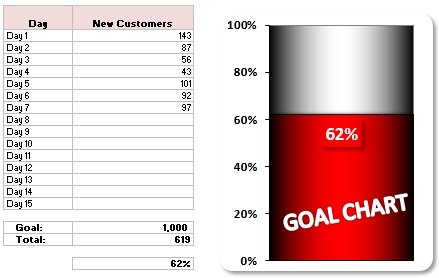
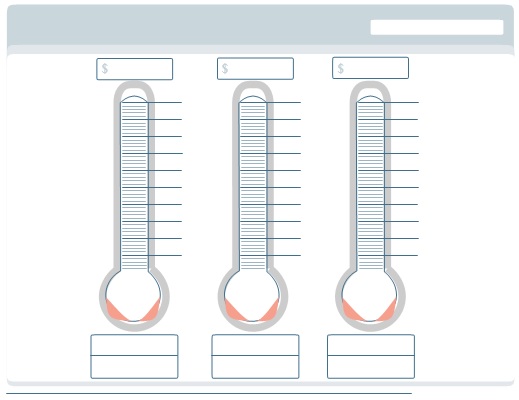
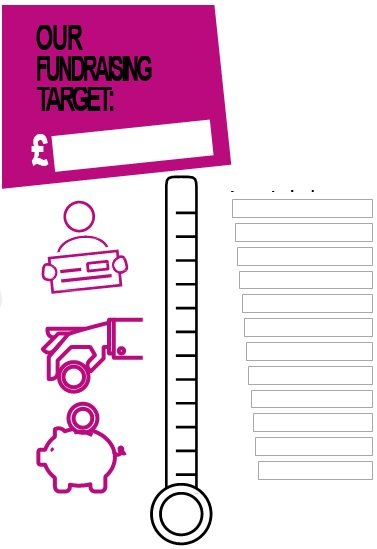
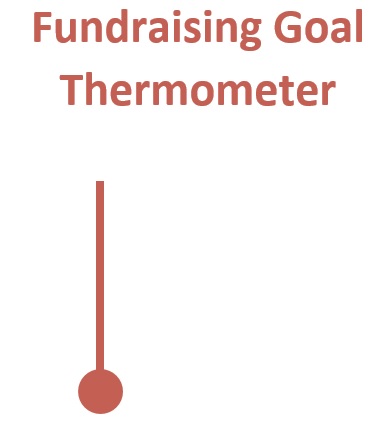
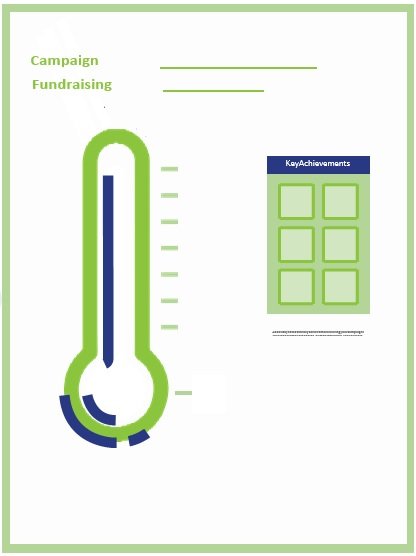
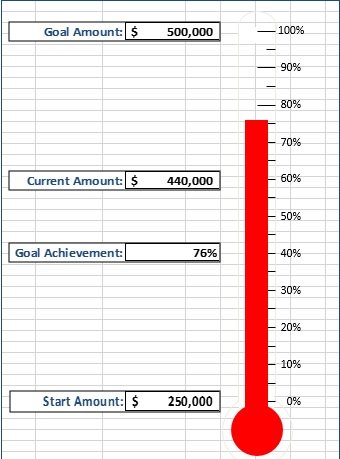
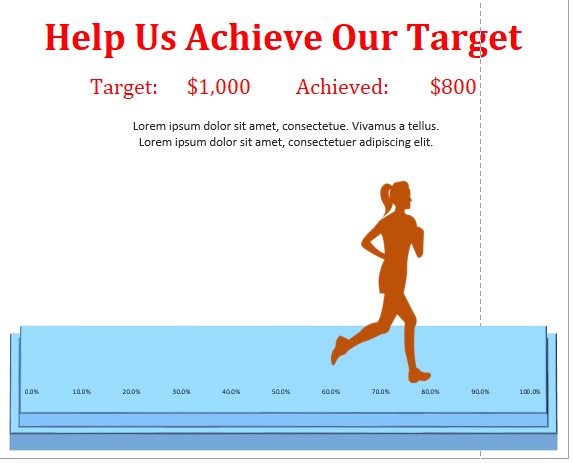
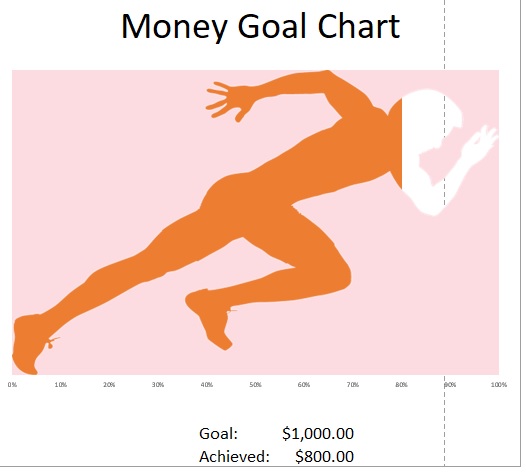
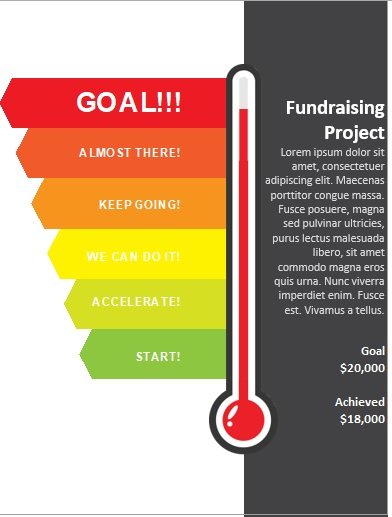
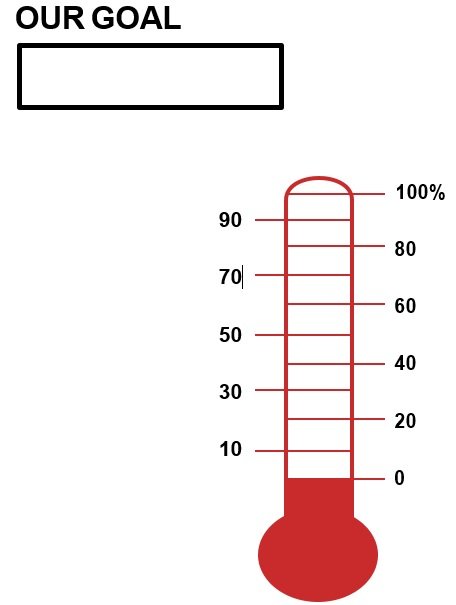
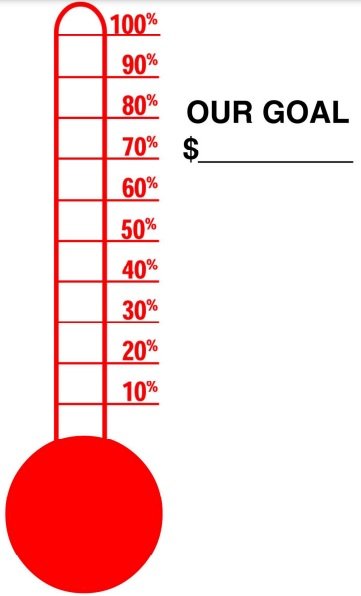
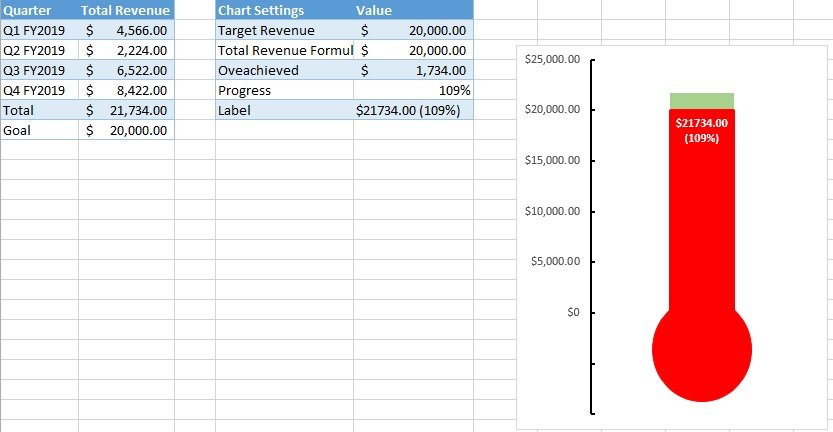
You should use a thermometer goal chart for keeping track of a specific goal with the achievements made within a set time frame. It is the most common type of goal chart template. It is generally used when you have to compare a target value and an actual value.
You should follow the below steps to make this goal chart in Excel;
Prepare your data
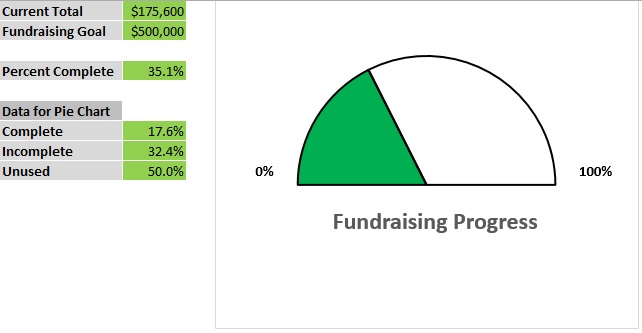
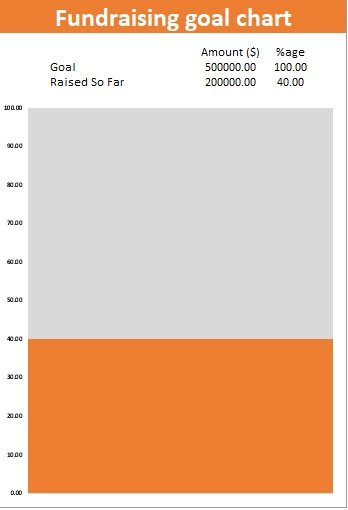
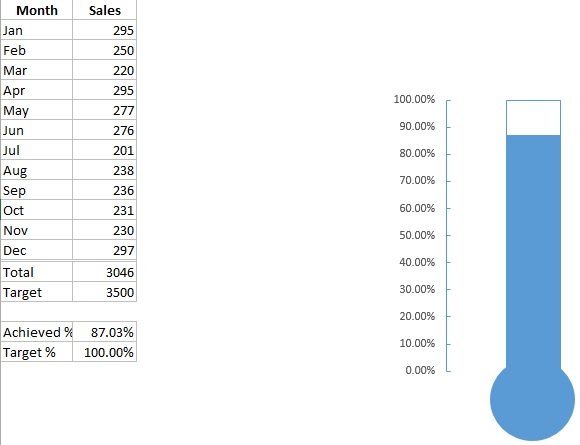
As with most projects, data collection is the first step when creating a thermometer goal sheet printable. It is also important to indicate your target percentage in percent. You have to divide the total amount by the target amount in order to get the archived percentage and then multiply the amount by 100.
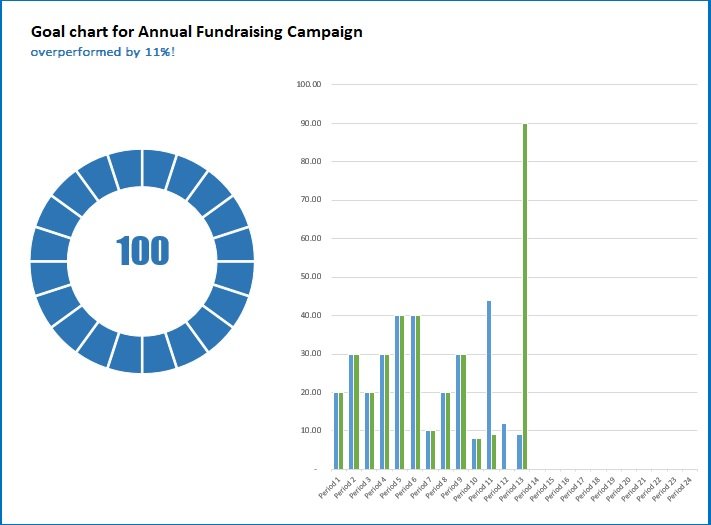
Create a stacked column chart
Next, by using the chart data, you have to make a simple chart that you have just prepared. For doing this, you have to create a stacked column chart in Excel. Follow the below steps to do this;
- Choose the Target and Archived.
- Click on the Insert tab.
- Go to the chart group and then click on the Insert Column or Bar Chart.
- Click on the 2D Clustered Column from the drop-down menu.
When you have all done with above steps, you will have a graph that looks like the top part of a thermometer.
Switch the columns or rows
For switching the columns or rows, right-click on the goal graph then click on Select Data.
Select the data
- From the select window that pops up, click on the Switch Row/Column then click on OK.
- Next, you have to format the 2nd column. For this, you have to right-click on the column the select format data series.
- From the dialog box, select the Secondary Axis. This assists you in making sure that both bars align with each other.
- After this, you have two vertical axes i.e. the right axis and the left axis. These two vertical axes have different values. You have to format the axis on the left. To do this, you have to first right-click on it then select Format Axis.
Format Axis
In this step, you have to modify the maximum value to 1, and the minimum value to 0. Even the values ae already there, you should do this manually. Next, delete the right axis. To do this, select it and then press delete.
Now, you will only have 1 visible chart. You have to format it. Right-click on the chart to do this then select Format Data Series. Then, follow the below steps;
- Select No Fill for the fill.
- Select Solid Line for the border.
- You should ensure that the color of the border is similar to the actual value bar. You have to delete the grid, lines, title, the legend, and the horizontal and vertical axes. At the same, to make the graph just look like a thermometer graph, you can resize it. The thermometer graph should look like an actual thermometer after changing the size.
- You have to format the left-axis. On the left-axis, right click and then select Format Axis. Choose Inside as the Major Tick Mark Type in the window that pops-up.
- The next step is to select the chart outline. For this, right-click on the chart and select the Chart Area. A task panel will appear from where you should select the following;
1- Select No Fill for the fill.
2- Select No line for the border. - At the bottom of the graph, you must add a circle in order to make your thermometer graph. Now, to do this, click on the Insert tab and then from drop-down menu, insert a circle. The circle should have the identical color as the graph itself.
How to make a goal tracker?
Consider the following steps to make your own goal tracker;
Select the place where you will put it
Firstly, you have to decide the place where your goal chart or tracker will stay. You may place it in notebooks, apps, or Google Sheets document. Before deciding it, keep in mind that you have to;
- Frequently use the tracker
- Make amendments to it often
- All the time keep it close
Write down your goal
This is the next step where you have to write your goal briefly. Use a single sentence to express it.
Consider the reason of your goal
Here, you have to think about the reason that why you want to accomplish this goal. This way, you can get clear thoughts.
Include significant notes
In the next section, include significant notes such as anything you have to remember or point out. You should ensure that there is a note section for each of the goals.
Keep track of your progress
In the last step, establish your tracker. This tracker is used to track the completed steps that you have taken to reach your goal.

Conclusion:
In conclusion, a goal chart template is a helpful tool that helps you in achieving your desired goals. This chart has boxes that you will fill with your goals and the steps to achieve them.
Faqs (Frequently Asked Questions)
Goal setting refers to determine a vision, defining goals, and mapping out steps to accomplish them.
The goal-setting theory is formulated in 1968. According to this theory, setting out a goal enhances the chances of accomplishing objectives.