A Fishbone diagram template is a type of template used to create fishbone diagram for cause analysis and problem-solving. This document is developed some time ago and used all over the world. It is the best possible way of capturing team ideas.
What is a fishbone diagram?
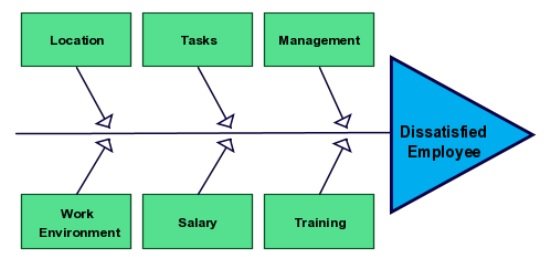
A Fishbone diagram is a helpful tool that provides effective and quick route in the pursuit of corrective actions. The other names of this tool are Ishikawa diagram or Cause and Effect diagram. It is known as Ishikawa diagram because it was developed by Kaoru Ishikawa in 1968. This diagram was introduced for the quality management process.
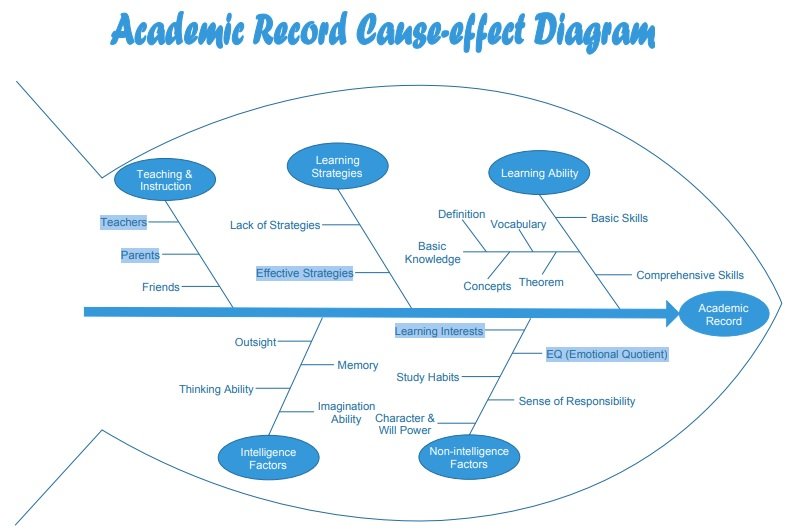
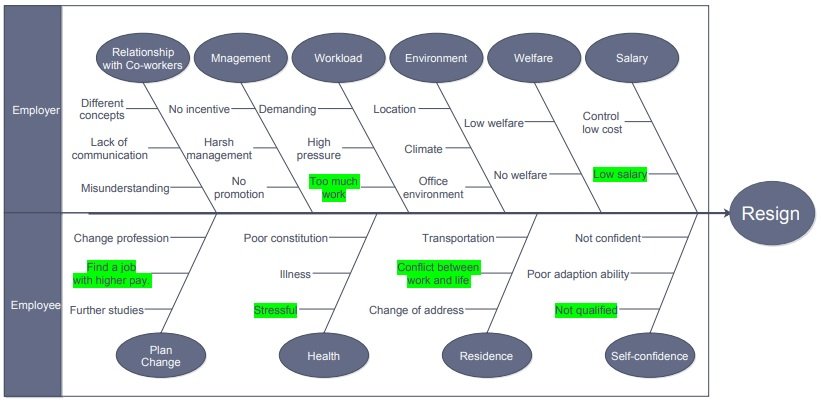
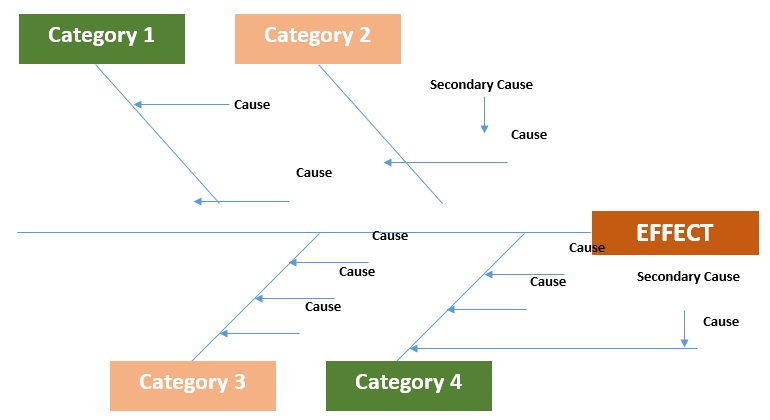
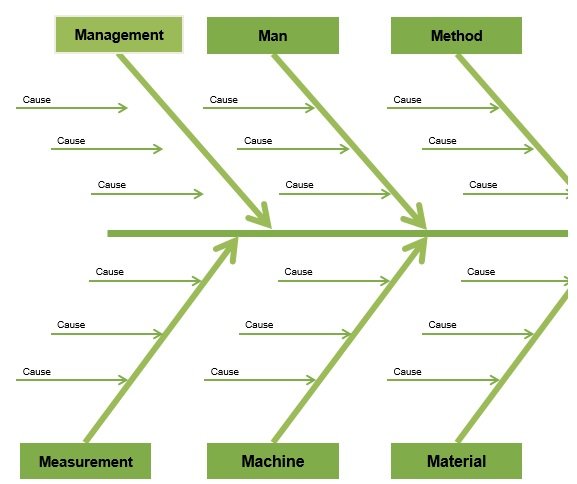
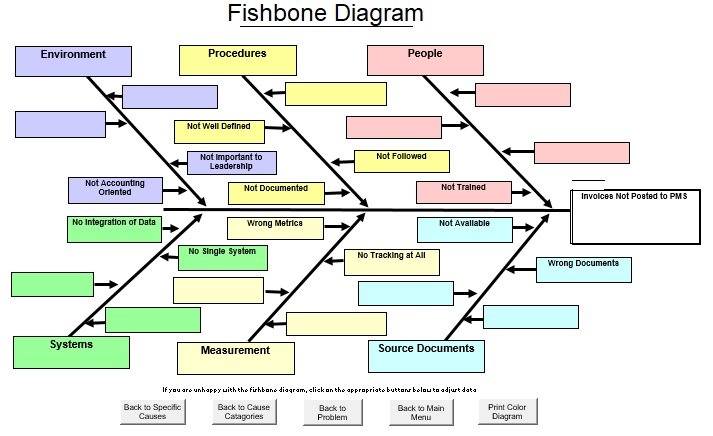
Moreover, it is used for brainstorming issues and solving particular problems. When the problem is identified, the team start focuses on why the problem has occurred. They focus on the symptoms or history of the problem. The fishbone diagram has two causes i.e. the primary and secondary cause. The primary cause directly leads to the effect. On the other hand, the secondary cause leads to a primary cause which doesn’t directly have an end effect. However, the causes are grouped into key categories. These categories are mentioned below;
- Methods: It consists of the details of the process and some particular requirements.
- People: These are the ones who participated in the process.
- Machines: Computers, tools, etc. are used to fulfill the task and job.
- Measurements: The data that is generated from the process are known as measurements. It is used to evaluate quality.
- Environment: It includes conditions, time, temperature in which the process operate.
- Materials: It contains the materials used to produce the final product.
All these above elements are categorized in the Fishbone diagram separately.
How to use the Fishbone Diagram?
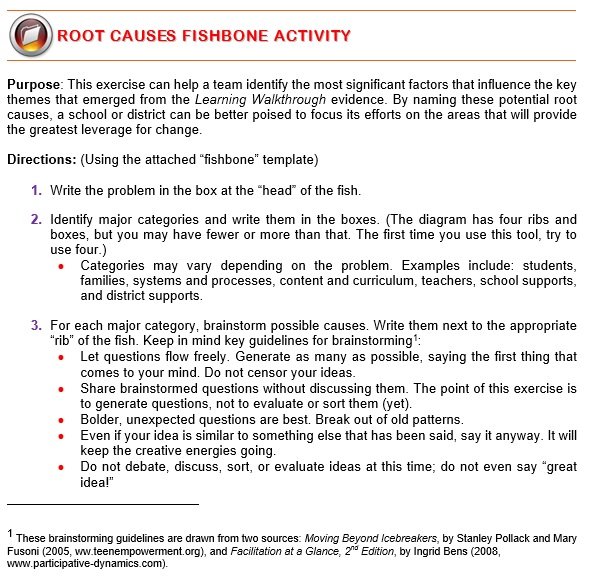
Here are some steps on how to use a Fishbone diagram;
Determine the problem:
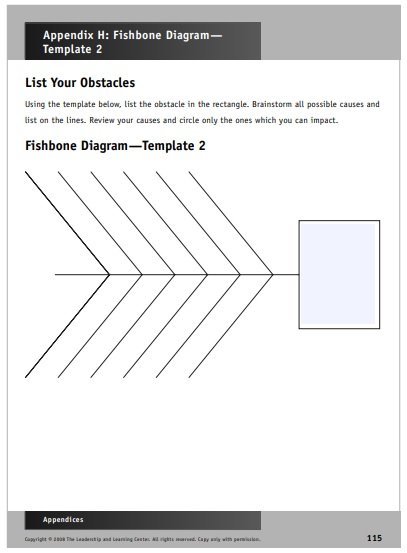
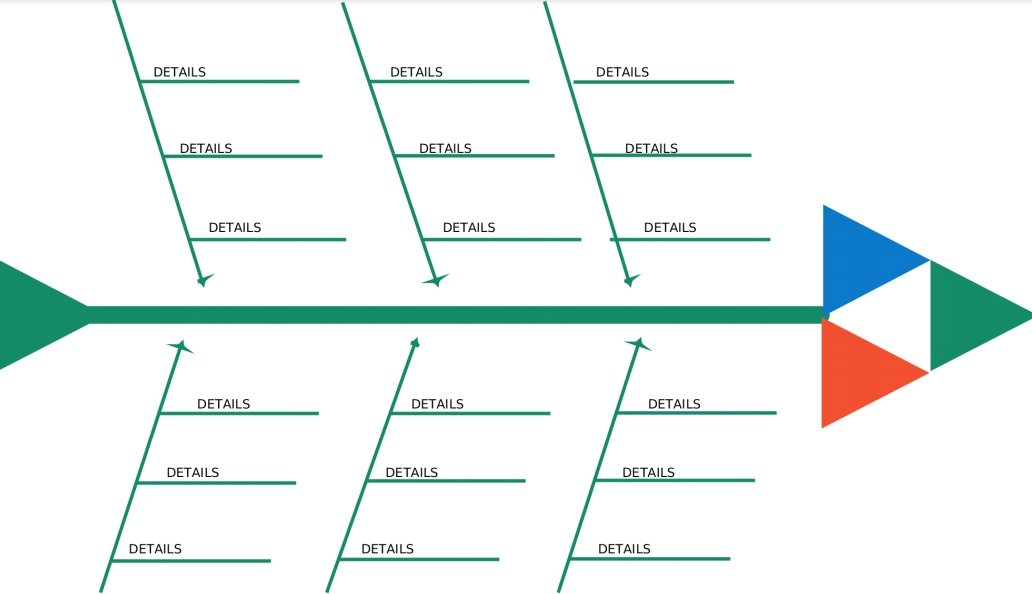
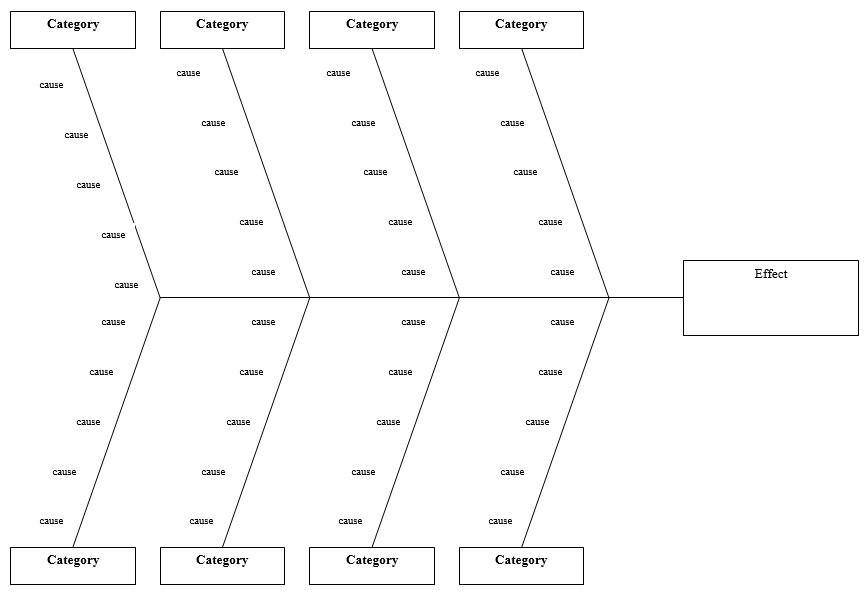
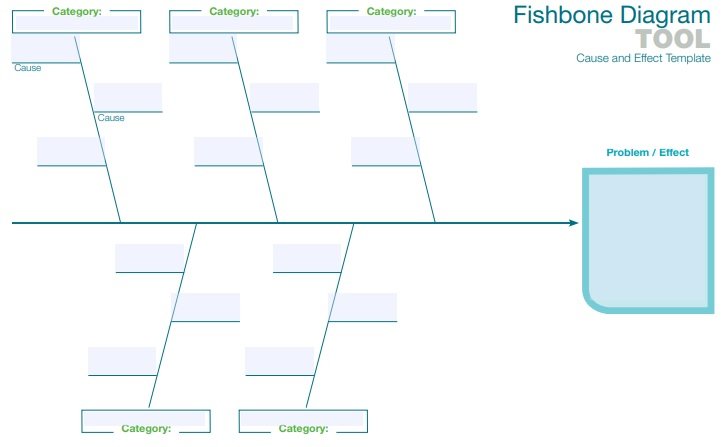
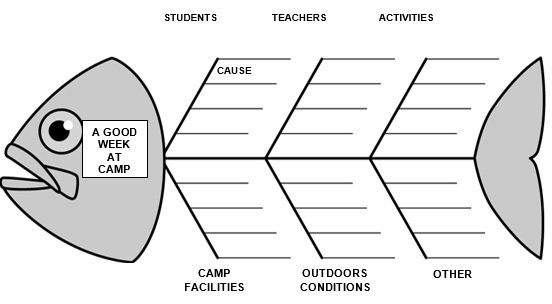
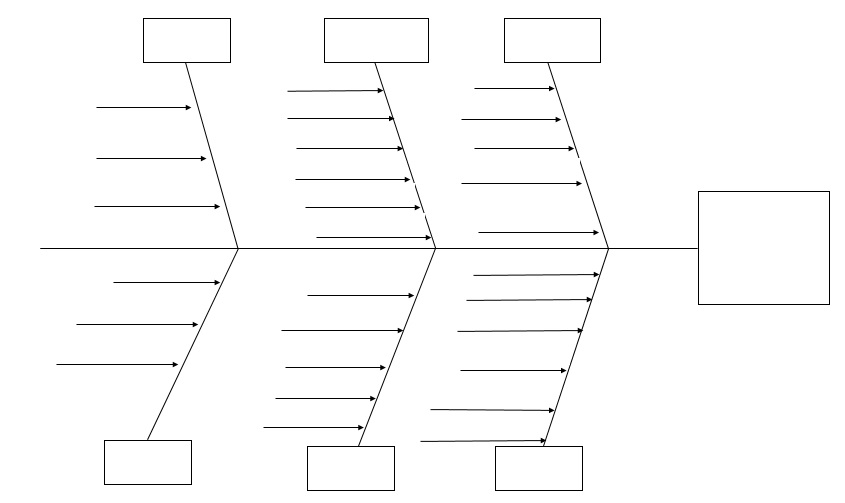
At first, identify the problem that you are facing. Then, find out who is involved in it, when, and where it happened. Take a large sheet of paper and on the left hand side of it write the problem in the box. Next, draw line in the horizontal way it would just like the head of the spine.
Major factors involved:
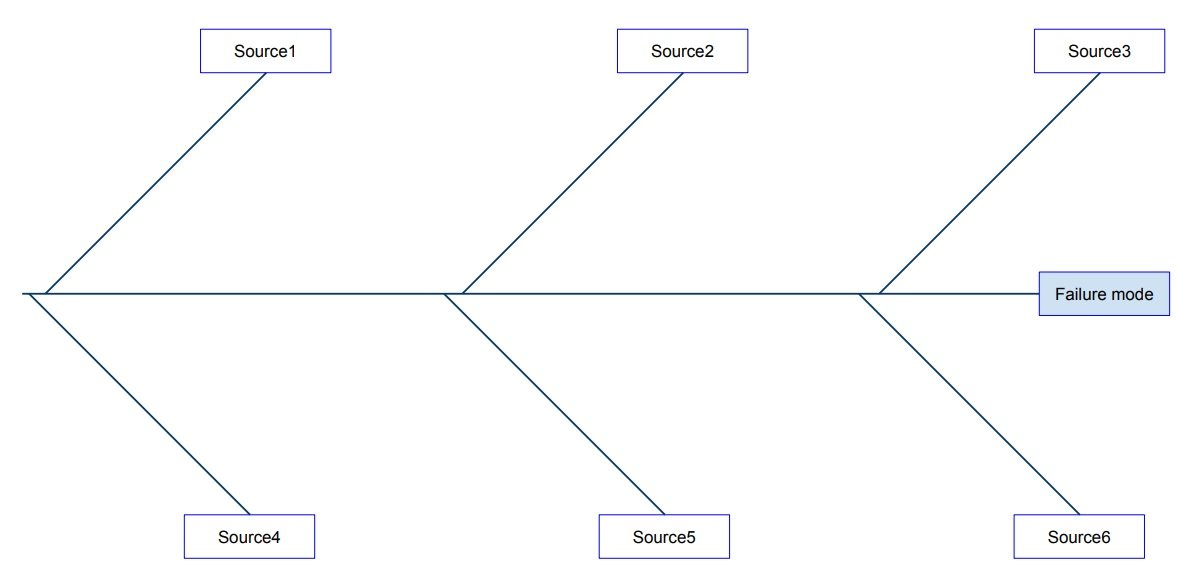
Now, identify the factors that are the part of the problem. Factors like equipment, people, materials, systems, etc are involved with the problem. Here you have to brainstorm affects of the condition and draw line off the spine.
Determine the potential reasons:
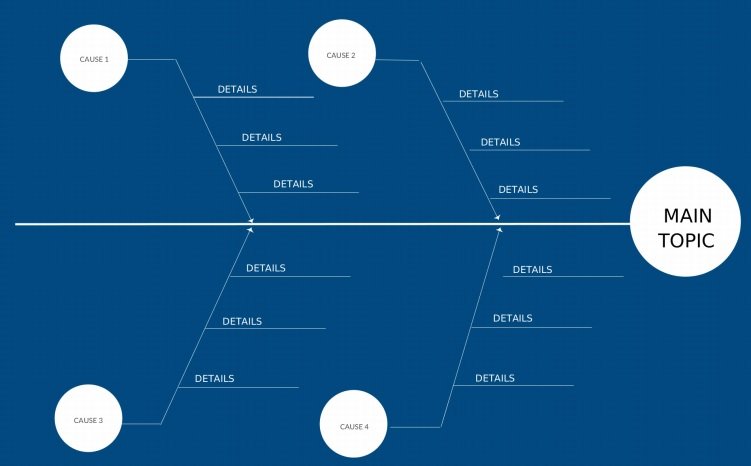
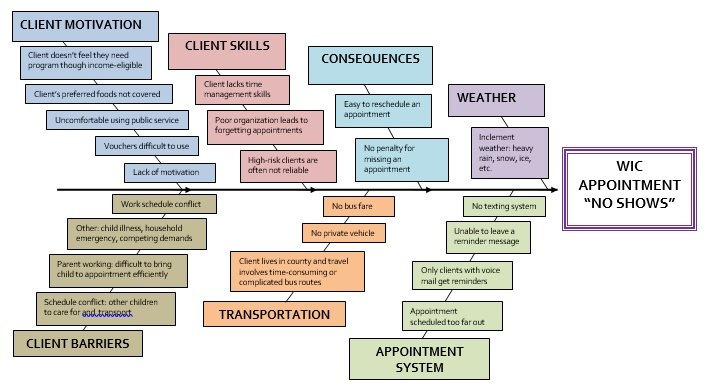
In this section, determine the potential reasons. They are somehow related to those factors. Write the potential causes using fewer words in the shorter lines. They can come off the bones of the diagram. If the cause of the problem is complex then break it down into sub causes.
Evaluate the diagram:
Finally, you have the diagram in front of you. This diagram shows the potential reasons of the problem. Depending on the importance and complexity of the problem, you can now further carry out surveys or set up investigations. On a sticky note, list down all the potential causes of the problem. After doing this, group the similar problems.
Uses of the Fishbone diagram:
A fishbone diagram can be used for various purposes. Some of them are as follow;
In manufacturing:
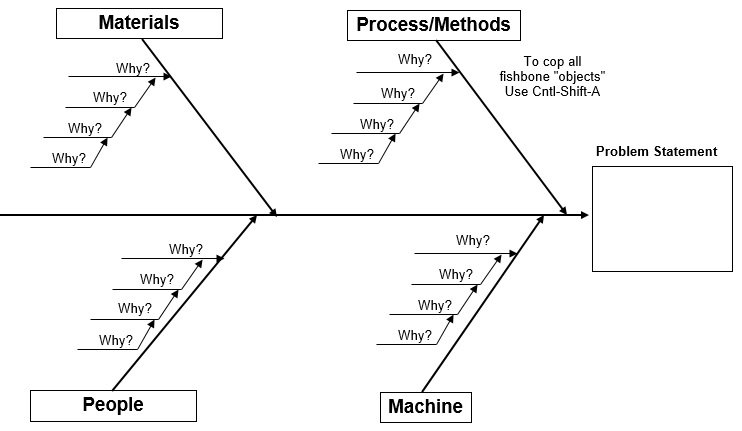
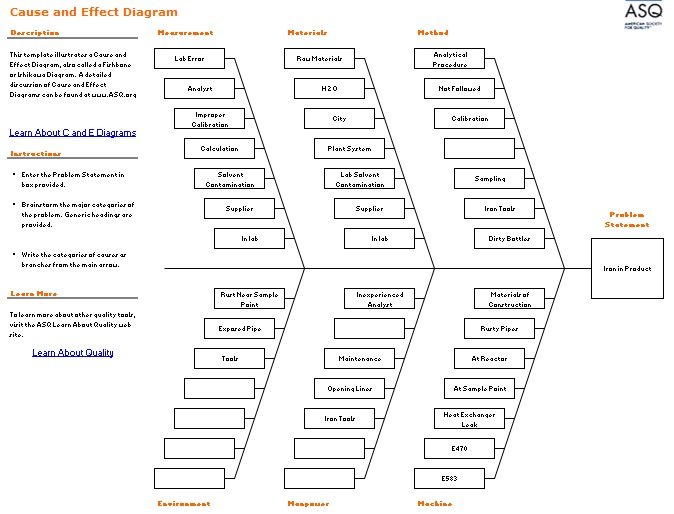
In manufacturing or any other area, you should first know the outcome of analysis. Then, add effect to the diagram and give bones to the fish. The causes are divided into 6 main branches which are known as the 6 Ms of manufacturing. These are;
- Measurement
- Machine
- Material
- Method
- Man power
- Mother nature or Milieu
All these Ms are globally recognized standards and some industry also used more standards to expand it further. They add more management and maintenance to the diagram.
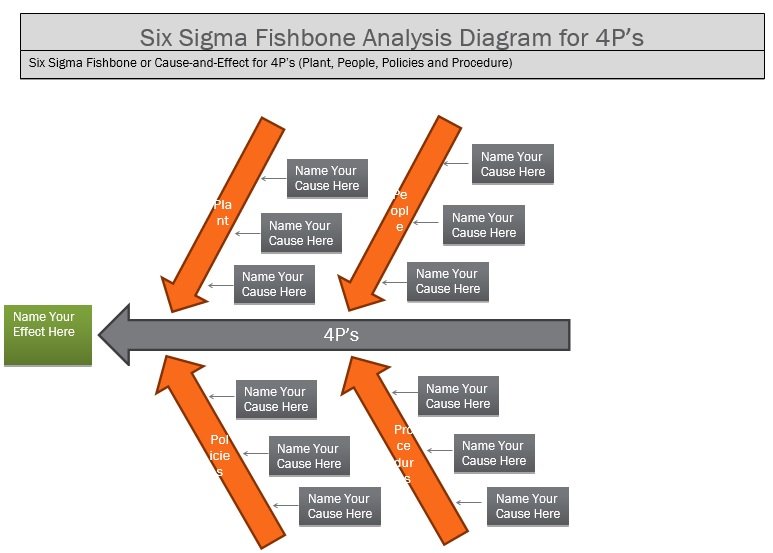
In marketing:
This diagram hugely provides benefit in marketing. Furthermore, it is one of the best ways to see ideas visually. It has 7 Ps that are given below;
- Place
- Product
- People
- Price
- Promotion
- Physical evidence
- Processes
All these 7 Ps are the branches of the diagram. They may not affect the marketing process.
In sales process:
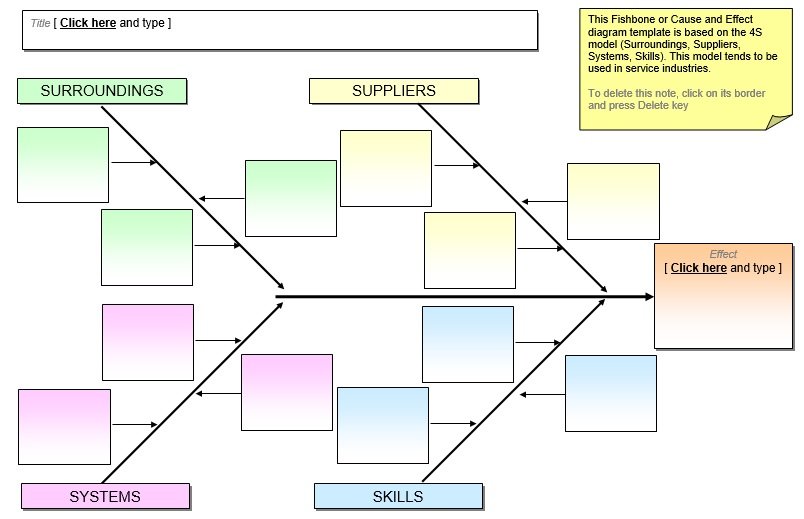
The fishbone diagram is also helpful and effective in the sales process. It has 5 S, listed below;
- Schemes
- Samples
- Skin
- Search
- Synchronous
Some tips for using the Fishbone Diagram:
Here are some tips for using the fishbone diagram;
- Most importantly, you should communicate the objective of the meeting. Everyone should review the objectives before beginning the meeting.
- Display the fishbone diagram in the beginning of the meeting.
- Fishbone diagram is just like the brainstorming. The main goal of this diagram is to write down the possible reasons without debating ideas and criticizing. Once the fishbone diagram is completed, prioritize the possible causes.
- Ask other members of team to write the potential causes on the large sticky notes. When they have written their ideas, ask everyone to explain their ideas. In this way, you can engage each and everyone.
- Keep the meeting moving and don’t stick on one cause for long.
When can you use a fishbone diagram template?
You can use a fishbone diagram in any situation where you have to understand all of the contributing factors to a problem. With the help of a template, you can split down the problem and its possible causes in a hierarchical way. Other uses are;
- Brainstorm the problem causes
- Determine a problem statement
- Analyze a new design
- Evaluate ways to improve an existing process
- Make sure quality improvement
You should take time to understand the entire system instead of rushing through it. Having many perspectives can be an asset, you need a good understanding of the processes, considerable brainstorming, and analysis.
The advantages of using a fishbone diagram:
Let us discuss below the advantages of using a fishbone diagram;
Pay attention to a cause instead of symptoms
Rather than explaining the situation and mistaking secondary causes for the root cause, the teams through a fishbone diagram can get to the heart of why something is occurring.
See all potential causes at once
A fishbone diagram presents multiple causes in a visual manner and is ordered logically. The stakeholders can investigate and understand how to fit together holistically.
Make a prompt for brainstorming
For a structured brainstorming exercise, many teams use a fishbone diagram as a jumping-off point in order to form a large number of potential ideas regarding what the root cause could be.
Pay attention to everyone on the root cause
A fishbone diagram makes the team able to pay attention to working together, analyzing, and prioritizing different possibilities rather than determining the causes of a problem independently.
Conclusion:
In conclusion, a Fishbone diagram template is a simple tool used to identify the major cause or root cause of the problem. The fishbone diagram displays many potential causes for a particular effect or problem. It was developed some time ago and considered as the best possible way of capturing team ideas.